c++-MFC 绘制单一颜色三角形、渐变颜色边框三角形、渐变填充三角形、正弦函数曲线实例
推荐 原创MFC 绘制三种不同圆形以及绘制正弦函数曲线
本文使用visual Studio MFC 平台实现绘制单一颜色圆形、渐变颜色边框圆形、渐变填充圆形以及绘制三角函数正弦函数曲线.
关于基础工程的创建请参考
01-Visual Studio 使用MFC 单文档工程绘制单一颜色直线和绘制渐变颜色的直线02-visual Studio MFC 绘制单一颜色三角形、渐变颜色边框三角形、渐变填充三角形、边框渐变的正方形与填充渐变的正方形实例
一、绘制单一颜色圆形
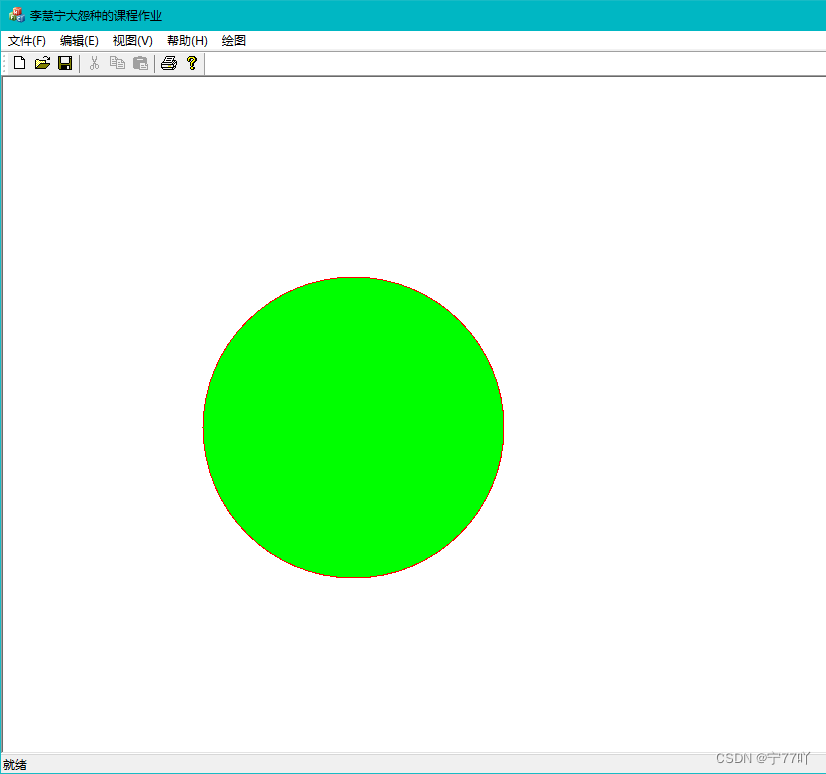
要绘制边框颜色单一、填充颜色单一的圆形,你可以使用 Graphics 对象的 DrawEllipse 方法和 FillEllipse 方法。以下是一个示例:
Graphics graphics(GetSafeHwnd());

// 定义圆形的位置和大小
RectF ellipseRect(200.0f, 200.0f, 300.0f, 300.0f);

// 定义边框颜色
Gdiplus::Color borderColor(255, 0, 0);  // 红色

// 定义填充颜色
Color fillColor(0, 255, 0);  // 绿色

// 创建边框画笔
Gdiplus::Pen borderPen(borderColor, 2.0f);  // 2.0f 是边框的宽度

// 创建填充画刷
SolidBrush fillBrush(fillColor);

// 绘制边框
graphics.DrawEllipse(&borderPen, ellipseRect);

// 填充圆形
graphics.FillEllipse(&fillBrush, ellipseRect);
这段代码中,DrawEllipse 用于绘制边框,FillEllipse 用于填充圆形。你可以根据需要调整 borderColor 和 fillColor 来设置边框和填充的颜色。
RectF 是 Gdiplus 库中表示矩形区域的类。RectF 的构造函数接受四个参数,分别是矩形的左上角的 x 坐标、y 坐标,以及矩形的宽度和高度。
在上述代码中,ellipseRect 表示一个矩形,它的左上角位于 (100.0f, 100.0f),宽度和高度都是 100.0f。这个矩形用来定义渐变圆形的位置和大小。在 FillEllipse 函数中,该矩形是用来指定要填充的椭圆的位置和大小的。
具体而言,ellipseRect 的参数顺序是:
x:矩形左上角的 x 坐标。y:矩形左上角的 y 坐标。width:矩形的宽度。height:矩形的高度。
因此,RectF ellipseRect(100.0f, 100.0f, 100.0f, 100.0f); 表示一个左上角坐标为 (100.0f, 100.0f),宽度和高度都为 100.0f 的矩形。
实现效果.

二、绘制渐变色边框的圆形
要绘制一个边框渐变的圆形,可以使用 DrawEllipse 函数。以下是一个示例代码片段:
// 创建 GDI+ 绘图对象
Graphics graphics(GetSafeHwnd());

// 定义两个渐变色
Color color1(255, 0, 0);  // 红色
Color color2(0, 0, 255);  // 蓝色

// 创建渐变画笔
LinearGradientBrush brush(Point(0, 0), Point(100, 100), color1, color2);

REAL positions[] = {
    0.0f, 1.0f};
Color colors[] = {
    color1, color2};
brush.SetInterpolationColors(colors, positions, 2);

// 定义圆形的位置和大小
RectF ellipseRect(100.0f, 100.0f, 100.0f, 100.0f);

// 使用渐变画笔绘制圆形边框
graphics.DrawEllipse(&Pen(&brush, 5), ellipseRect);
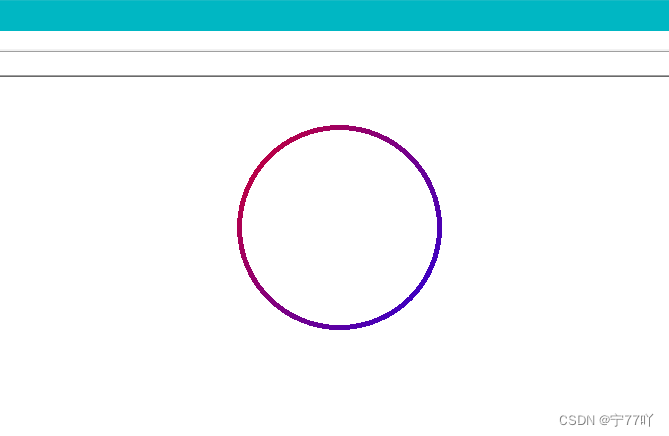
在这个例子中,我们使用 DrawEllipse 函数绘制了一个带有渐变边框的圆形。我们使用 LinearGradientBrush 作为画笔的颜色,并使用 Pen 的构造函数设置画笔的宽度。 Brush 的构造函数接受两个点,这里我们使用 Point(0, 0) 和 Point(100, 100) 定义了一个渐变的范围。
实现效果.

三、绘制渐变色填充的圆形
要绘制填充渐变的圆形,可以使用 FillEllipse 函数。以下是一个示例代码片段:
// 创建 GDI+ 绘图对象
Graphics graphics(GetSafeHwnd());

// 定义两个渐变色
Color color1(255, 0, 0);  // 红色
Color color2(0, 0, 255);  // 蓝色

// 创建渐变画刷
LinearGradientBrush brush(Point(0, 0), Point(100, 100), color1, color2);

REAL positions[] = {
    0.0f, 1.0f};
Color colors[] = {
    color1, color2};
brush.SetInterpolationColors(colors, positions, 2);

// 定义圆形的位置和大小
RectF ellipseRect(100.0f, 100.0f, 100.0f, 100.0f);

// 使用渐变画刷填充圆形
graphics.FillEllipse(&brush, ellipseRect);
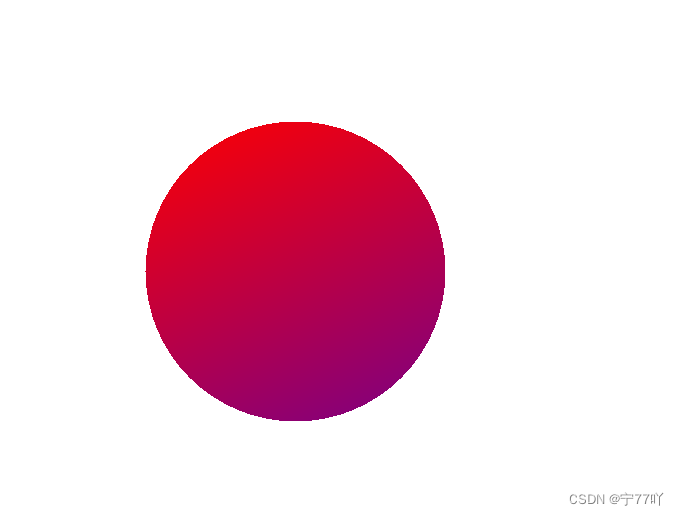
在这个例子中,我们使用 FillEllipse 函数绘制了一个填充渐变的圆形。我们使用 LinearGradientBrush 作为画刷的颜色,并使用 SetInterpolationColors 设置渐变的颜色。 Brush 的构造函数接受两个点,这里我们使用 Point(0, 0) 和 Point(100, 100) 定义了一个渐变的范围。
实现效果.

四、绘制三角函数(正弦)曲线
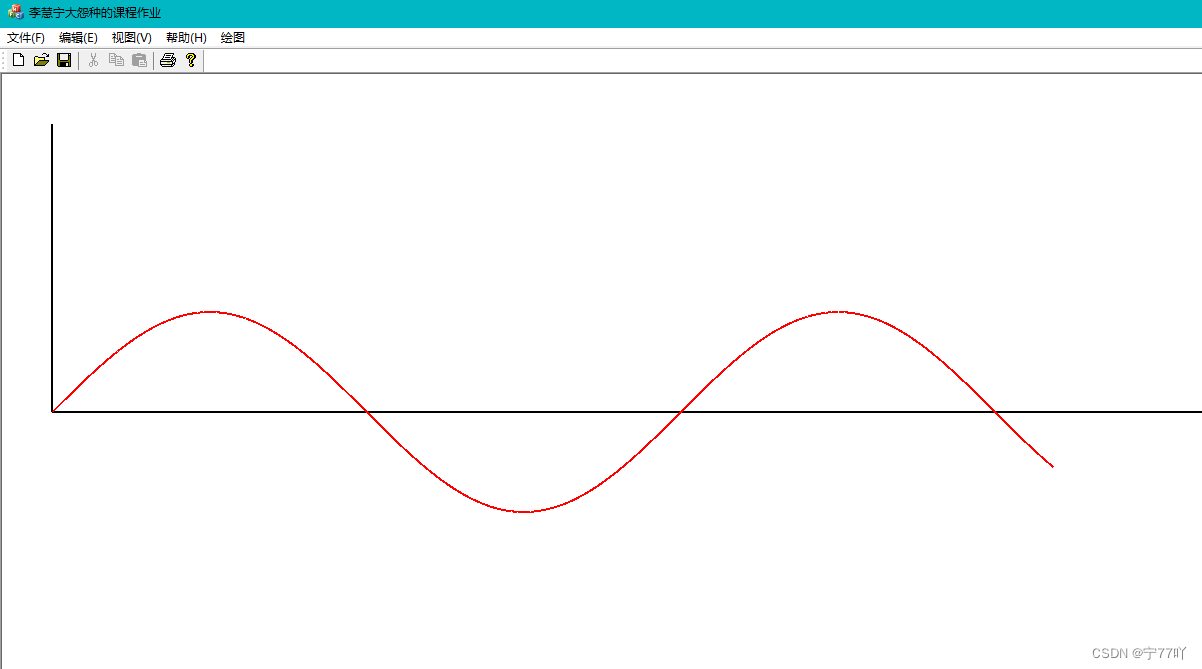
使用GDI+库在窗口中绘制了一个简单的直角坐标系和一个正弦波形。
-
创建绘图对象:
Graphics graphics(GetSafeHwnd());- 通过窗口句柄初始化
Graphics对象,表示一个绘图图面。
- 通过窗口句柄初始化
-
获取客户区域大小和设置坐标系原点:
CRect clientRect; GetClientRect(&clientRect); PointF origin(50.0f, clientRect.Height() / 2.0f);GetClientRect获取窗口客户区域的大小。origin定义了坐标系的原点,位于 (50.0f, clientRect.Height() / 2.0f) 处。
-
绘制直角坐标系:
Pen axisPen(Color::Black, 2.0f); graphics.DrawLine(&axisPen, origin.X, origin.Y, clientRect.Width() - 50.0f, origin.Y); // X 轴 graphics.DrawLine(&axisPen, origin.X, origin.Y, origin.X, 50.0f); // Y 轴- 创建一个黑色、宽度为 2.0f 的画笔。
- 使用
graphics.DrawLine画笔对象绘制 X 轴和 Y 轴。
-
绘制正弦波形:
Pen sineWavePen(Color::Red, 2.0f); const int waveLength = 1000; const int amplitude = 100; const float frequency = 0.01f; for (int x = 0; x <= waveLength; ++x) { float y = amplitude * sin(frequency * x); graphics.DrawLine(&sineWavePen, origin.X + x, origin.Y - y, origin.X + x + 1, origin.Y - amplitude * sin(frequency * (x + 1))); }- 创建一个红色、宽度为 2.0f 的画笔。
- 使用
for循环遍历 X 轴上的点,计算对应的正弦波形上的 Y 值。 - 使用
graphics.DrawLine画笔对象绘制相邻的两个点,形成正弦波形。
源码.
Graphics graphics(GetSafeHwnd());

// 获取视图的客户区域大小
CRect clientRect;
GetClientRect(&clientRect);

// 设置坐标系原点
PointF origin(50.0f, clientRect.Height() / 2.0f);

// 绘制直角坐标系
Pen axisPen(Color::Black, 2.0f);
graphics.DrawLine(&axisPen, origin.X, origin.Y, clientRect.Width() - 50.0f, origin.Y); // X 轴
graphics.DrawLine(&axisPen, origin.X, origin.Y, origin.X, 50.0f); // Y 轴

// 绘制正弦波形
Pen sineWavePen(Color::Red, 2.0f);
const int waveLength = 1000;
const int amplitude = 100;
const float frequency = 0.01f;

for (int x = 0; x <= waveLength; ++x) {

 float y = amplitude * sin(frequency * x);
 graphics.DrawLine(&sineWavePen, origin.X + x, origin.Y - y, origin.X + x + 1, origin.Y - amplitude * sin(frequency * (x + 1)));
}
实现效果.

更多【c++-MFC 绘制单一颜色三角形、渐变颜色边框三角形、渐变填充三角形、正弦函数曲线实例】相关视频教程:www.yxfzedu.com
相关文章推荐
- pdf-PDF有限制密码,不能复制怎么办? - 其他
- objective-c-【Objective-C】Objective-C汇总 - 其他
- node.js-npm切换镜像源 - 其他
- github-Jekyll框架编译GithubPages,提示没有docs - 其他
- node.js-npm 换源 - 其他
- objective-c-C++模板元模板(异类词典与policy模板)- - - 题目答案 - 其他
- github-本周Github有趣开源项目:Rspress等6个 - 其他
- node.js-运行npm install卡住不动的几种解决方案 - 其他
- 数据库-2023年开发语言和数据库排行 - 其他
- android-Android Studio导入,删除第三方库 - 其他
- ai编程-VSCode使用插件Github Copilot进行AI编程 - 其他
- node.js-如何上传自己的npm包 - 其他
- android-2023年11月PHP测试覆盖率解决方案 - 其他
- android-android studio 修改图标 - 其他
- 电脑-Mac电脑专业raw图像处理 DxO PhotoLab 7中文最新 for mac - 其他
- ios-Home Assistant使用ios主题更换背景 - 其他
- node.js-更改 npm的默认缓存地址 - 其他
- 编程技术-青岛华晟智能与陇西县政府签约,共同推动东西部协作产业升级 - 其他
- 编程技术-K8S集群调度 - 其他
- 编程技术-POWER APPS:必填项功能 - 其他
2):严禁色情、血腥、暴力
3):严禁发布任何形式的广告贴
4):严禁发表关于中国的政治类话题
5):严格遵守中国互联网法律法规
6):有侵权,疑问可发邮件至service@yxfzedu.com
- node.js-Node.js如何处理多个请求?
- golang-【二、http】go的http基本请求设置(设置查询参数、定制请求头)get和post类似
- 算法-平面和射线交点
- 编程技术-从白日梦到现实:推出 Elastic 的管道查询语言 ES|QL
- 前端-Redisson实现延迟队列
- 编程技术-MATLAB|怎么将散点图替换成图片
- 科技-第二证券:消费电子概念活跃,博硕科技“20cm”涨停,天龙股份斩获10连板
- 科技-思谋科技进博首秀:工业多模态大模型IndustryGPT V1.0正式发布
- 科技-智能井盖传感器功能,万宾科技产品介绍
- 科技-专访虚拟人科技:如何利用 3DCAT 实时云渲染打造元宇宙空间